FOR MAPLE RIDGE & PITT MEADOWS
Students first.
Accountability
always.
I’m running for SD42 School Trustee to bring independent judgment, responsible leadership, and a parent’s voice to the board.
 KOUROSH AHMADIAN MBA
YOUR VOICE
AT THE BOARD
AT THE BOARD
THE CHOICE IN THIS ELECTION
“When families ask hard questions, they deserve real answers—and when something goes wrong, leadership must act.”
MY COMMITMENTS
What I’ll fight for.
Practical priorities grounded in what students, educators, and families need from their school board.
Safe schools, every day
Clear safety standards, timely incident response, and decisions that put the well-being of every student first.
Transparency you can see
Plain-language answers, accessible records, and follow-through when families raise serious concerns.
Parents at the table
Respectful, meaningful engagement with families—before decisions are made, not after the fact.
Responsible stewardship
Budgets focused on classrooms, student support, and measurable outcomes for our community.
WHERE SD42 STANDS
Following the public dollars.
A province-wide comparison of 2024–25 actual operating spending across all 60 B.C. school districts, followed by a closer look at districts with broadly similar student populations. The figures use Ministry of Education and Child Care financial tables for the year ended June 30, 2025.
SD42 operating cost$12,591per funded FTE student
Essentially equal to the B.C. average of $12,604—just 0.1% lower.
15 districts, or 25.4%, spend less per funded FTE than SD42.
53 districts, or 89.8%, devote a smaller share of operating expense to salaries and benefits.
SD42 is near the provincial cost average, but more of each operating dollar is committed to labour.
2011 → 2018 → 2025
Did SD42’s benchmark position get better or worse?
Mixed—but budget flexibility worsened. SD42’s total operating cost per funded student is near the B.C. average today. Over time, however, inflation-adjusted cost per student rose while the share committed to salaries and benefits increased, leaving less of each operating dollar for services, supplies and other needs.
Current provincial position16th-lowest cost
In 2025, 15 districts spent less and 44 spent more per funded FTE. But SD42 had the 7th-highest labour share: only six districts were higher.
| Benchmark | 2011 | 2018 | 2025 | Direction since 2011 |
|---|---|---|---|---|
| Funded FTE students | 15,188 | 14,702 | 16,775 | 10.4% higher |
| Operating cost / FTE nominal dollars | $8,345 | $9,364 | $12,591 | Dollar amounts not inflation-adjusted |
| Operating cost / FTE 2025 dollars | $11,428 | $11,526 | $12,591 | 10.2% higher |
| Labour share of operating cost | 87.9% | 90.7% | 91.7% | 3.9 points higher |
| Teacher salaries / FTE 2025 dollars | $5,322 | $5,224 | $5,317 | Essentially flat |
| Principal & VP salaries / FTE 2025 dollars | $508 | $576 | $600 | 18% higher |
| Other professionals / FTE district administration and excluded staff · 2025 dollars | $261 | $328 | $452 | 73% higher |
| Combined administration categories / FTE P/VP + other professionals · 2025 dollars | $769 | $904 | $1,053 | 37% higher |
| Educational assistant salaries / FTE 2025 dollars | $751 | $1,021 | $1,512 | 101% higher |
Non-labour room fell from 12.1% of operating spending in 2011 to 8.3% in 2025. That means less flexibility after salaries and benefits are covered.
Real teacher salary spending per student stayed nearly flat. Real combined administration-category spending rose 37%, while real educational-assistant salary spending roughly doubled. These totals describe staffing mix and category spending—not individual wage rates.
The exact 2011 and 2018 provincial ranks are not shown because the older province-wide files are not available on the same reproducible, standardized basis as 2025. The site will not manufacture a historical rank.
| Salary category | SD42 / FTE | B.C. / FTE | SD42 vs B.C. | Other districts higher | Other districts lower |
|---|---|---|---|---|---|
| Teachers | $5,317 | $5,216 | 1.9% higher | 26 · 44.1% | 33 · 55.9% |
| Principals & vice-principals | $600 | $704 | 14.7% lower | 54 · 91.5% | 5 · 8.5% |
| Other professionals district administration and excluded staff | $452 | $378 | 19.8% higher | 38 · 64.4% | 21 · 35.6% |
| Combined administration categories P/VP + other professionals | $1,053 | $1,081 | 2.6% lower | 47 · 79.7% | 12 · 20.3% |
| Educational assistants | $1,512 | $1,083 | 39.6% higher | 8 · 13.6% | 51 · 86.4% |
How to read this: “Higher” and “lower” compare total category spending per funded FTE—not individual pay rates. The financial statements define “Other Professionals” to include superintendents, secretary-treasurers, trustees and other employees excluded from union contracts. The combined row adds that category to principals and vice-principals; it is a broad administration benchmark, not a count of positions or an average salary.
WHO WAS HIGHER THAN SD42?
Adding principals and vice-principals changes the result.
For “Other Professionals” alone, SD42 was $452 per funded student—19.8% above the provincial average—and 38 districts were higher. After adding principal and vice-principal salaries, SD42’s combined $1,053 was 2.6% below the B.C. average of $1,081, with 47 districts higher and 12 lower.
Adjusted administration comparison13th-lowest of 60P/VP + Other Professionals
This is the more complete administration-category comparison. It shows SD42 below the province-wide benchmark despite growth since 2011.
38 districts higher for Other Professionals only View full list
- SD75 Mission — $455 per FTE
- SD72 Campbell River — $457 per FTE
- SD62 Sooke — $458 per FTE
- SD22 Vernon — $463 per FTE
- SD67 Okanagan Skaha — $484 per FTE
- SD69 Qualicum — $484 per FTE
- SD83 North Okanagan–Shuswap — $485 per FTE
- SD28 Quesnel — $486 per FTE
- SD5 Southeast Kootenay — $525 per FTE
- SD20 Kootenay–Columbia — $530 per FTE
- SD8 Kootenay Lake — $562 per FTE
- SD63 Saanich — $568 per FTE
- SD59 Peace River South — $593 per FTE
- SD82 Coast Mountains — $600 per FTE
- SD58 Nicola–Similkameen — $609 per FTE
- SD46 Sunshine Coast — $633 per FTE
- SD57 Prince George — $645 per FTE
- SD51 Boundary — $662 per FTE
- SD48 Sea to Sky — $662 per FTE
- SD19 Revelstoke — $696 per FTE
- SD47 qathet — $727 per FTE
- SD91 Nechako Lakes — $735 per FTE
- SD53 Okanagan Similkameen — $741 per FTE
- SD54 Bulkley Valley — $742 per FTE
- SD85 Vancouver Island North — $786 per FTE
- SD78 Fraser–Cascade — $821 per FTE
- SD93 Conseil scolaire francophone — $829 per FTE
- SD52 Prince Rupert — $982 per FTE
- SD74 Gold Trail — $1,296 per FTE
- SD6 Rocky Mountain — $1,303 per FTE
- SD64 Gulf Islands — $1,354 per FTE
- SD81 Fort Nelson — $1,389 per FTE
- SD10 Arrow Lakes — $1,951 per FTE
- SD50 Haida Gwaii — $2,267 per FTE
- SD84 Vancouver Island West — $2,961 per FTE
- SD92 Nisga’a — $3,097 per FTE
- SD49 Central Coast — $3,123 per FTE
- SD87 Stikine — $3,251 per FTE
47 districts higher after adding principals and VPs View full list
- SD68 Nanaimo–Ladysmith — $1,056 per FTE
- SD44 North Vancouver — $1,090 per FTE
- SD71 Comox Valley — $1,095 per FTE
- SD79 Cowichan Valley — $1,122 per FTE
- SD73 Kamloops–Thompson — $1,142 per FTE
- SD45 West Vancouver — $1,150 per FTE
- SD22 Vernon — $1,187 per FTE
- SD20 Kootenay–Columbia — $1,221 per FTE
- SD62 Sooke — $1,230 per FTE
- SD75 Mission — $1,247 per FTE
- SD72 Campbell River — $1,253 per FTE
- SD63 Saanich — $1,254 per FTE
- SD67 Okanagan Skaha — $1,266 per FTE
- SD60 Peace River North — $1,310 per FTE
- SD83 North Okanagan–Shuswap — $1,333 per FTE
- SD70 Pacific Rim — $1,416 per FTE
- SD48 Sea to Sky — $1,421 per FTE
- SD46 Sunshine Coast — $1,443 per FTE
- SD69 Qualicum — $1,443 per FTE
- SD5 Southeast Kootenay — $1,452 per FTE
- SD57 Prince George — $1,483 per FTE
- SD8 Kootenay Lake — $1,493 per FTE
- SD27 Cariboo–Chilcotin — $1,513 per FTE
- SD82 Coast Mountains — $1,552 per FTE
- SD28 Quesnel — $1,584 per FTE
- SD58 Nicola–Similkameen — $1,638 per FTE
- SD53 Okanagan Similkameen — $1,656 per FTE
- SD47 qathet — $1,713 per FTE
- SD59 Peace River South — $1,795 per FTE
- SD51 Boundary — $1,820 per FTE
- SD19 Revelstoke — $1,842 per FTE
- SD91 Nechako Lakes — $1,882 per FTE
- SD54 Bulkley Valley — $1,904 per FTE
- SD93 Conseil scolaire francophone — $1,981 per FTE
- SD78 Fraser–Cascade — $2,113 per FTE
- SD52 Prince Rupert — $2,194 per FTE
- SD6 Rocky Mountain — $2,388 per FTE
- SD85 Vancouver Island North — $2,531 per FTE
- SD81 Fort Nelson — $2,596 per FTE
- SD64 Gulf Islands — $3,011 per FTE
- SD74 Gold Trail — $3,181 per FTE
- SD10 Arrow Lakes — $3,776 per FTE
- SD50 Haida Gwaii — $4,465 per FTE
- SD49 Central Coast — $5,564 per FTE
- SD92 Nisga’a — $6,214 per FTE
- SD87 Stikine — $6,505 per FTE
- SD84 Vancouver Island West — $8,620 per FTE
Districts are ordered from the closest amount above SD42 to the highest. Many of the largest per-student amounts occur in small, rural or remote districts where fixed administrative costs are spread across fewer students.
MY PROFESSIONAL VIEW
“As a finance and accounting professional, former commercial banker, business owner and builder, this did not sit well with me. In the private sector, an inflation-adjusted increase of this size would not be accepted without a clear reconciliation of staffing, compensation, responsibilities and measurable results.”
Combined administration-category spending per funded student increased 37% in real terms since 2011 and 16.4% since 2018. Although SD42’s 2025 combined amount is 2.6% below the current B.C. average, the increase over time still deserves a complete public explanation. Public institutions should be held to at least the same standard of financial discipline and accountability expected in private business.
TRUSTEES & SENIOR LEADERSHIP
What SD42 reported paying.
The district’s 2024–25 Statement of Financial Information reports remuneration and expenses separately. Remuneration is the statutory SOFI measure and should not automatically be read as base salary alone.
$28,139 in reported expenses
$134,223 in reported expenses
ACCOUNTABILITY CHECK
What changed during these governance periods?
For the board era beginning in 2018: the financial picture is mixed, with a clear loss of flexibility. Between 2018 and 2025, real operating cost per funded student rose 9.2%, labour’s share rose from 90.7% to 91.7%, real teacher-salary spending per student was nearly flat, real combined administration-category spending rose 16.4%, and real educational-assistant salary spending per student rose 48%.
Five people serving as trustees in 2025—Elaine Yamamoto, Kim Dumore, Mike Murray, Pascale Shaw and Katie Sullivan—also appear in the November 2018 inaugural board record. That makes the 2018-to-2025 trend a relevant record for voters to question. But board decisions are collective, and the membership changed during the period.
One current trustee does reach back to the 2011 board: Mike Murray. SD42’s December 7, 2011 inaugural minutes record Murray as elected for the 2011–2014 term, and SD42’s current trustee page still lists him as a trustee. He is the only name on today’s seven-member board that also appears on that 2011 trustee roster. His long-term governance record is therefore relevant for voters to examine. This is not an allegation of misconduct, dishonesty, or proof that he personally caused a district-wide financial trend: budgets and policy are collective board decisions, and board membership and management changed over the period.
The senior executive team did not span 2011–2025. Richard Rennie became Secretary Treasurer in 2023, and 2024 board records show the transition from Harry Dhillon to Teresa Downs as Superintendent. The long-term trend therefore reflects a district direction across multiple management teams and boards—not the work of one executive.
| Role | Person | Remuneration | Expenses |
|---|---|---|---|
| Elected officials | |||
| Board chair | Elaine Yamamoto | $33,850 | $6,350 |
| Vice-chair | Kim Dumore | $32,350 | $3,242 |
| Trustee | Five positions | $30,850 each | $18,547 combined |
| Executive and senior leadership | |||
| Superintendent & CEO | Teresa Downs | $300,693 | $14,133 |
| Secretary Treasurer & CFO | Richard Rennie | $271,240 | $14,782 |
| Deputy Superintendent | Cheryl Schwarz | $234,446 | $11,087 |
| Assistant Superintendents | Jovo Bikic, Kenneth Cober & David Vandergugten | $621,289 combined | $42,392 combined |
| Director, Human Resources | Dana Sirsiris | $210,346 | $15,806 |
| Assistant Secretary Treasurer | Iris Mo | $201,396 | $10,552 |
| Director, Facilities | Luigi Girotto | $197,567 | $3,270 |
| Director, Information Technology | Kevin Abma | $185,814 | $5,583 |
| Director, Learning Services | Michael Scarcella | $185,573 | $9,884 |
| Senior Manager, Communications | Irena Pochop | $140,896 | $6,734 |
Responsible interpretation: These figures show what SD42 disclosed, not whether a person is overpaid. A fair conclusion requires role scope, tenure, contract terms, benefits, performance expectations, and comparable-district data.
FOUR-YEAR SENIOR LEADERSHIP TREND
What has remuneration done, position by position?
2022 → 2025+20% to +34%
Nominal increase across six continuously disclosed senior leaders with comparable roles.
| Position / person | 2022 | 2023 | 2024 | 2025 | 2022→25 |
|---|---|---|---|---|---|
| Superintendent Dhillon → Downs | $230,794 | $265,877 | Transition year $287,515 + $97,408 | $300,693 | N/C* |
| Secretary Treasurer Coughlan → Rennie | $205,522 | $226,397 | $249,958 | $271,240 | +32.0%* |
| Deputy Superintendent Derinzy → Schwarz | $187,634 | $178,722 | $223,987 | $234,446 | +24.9%* |
| Assistant Superintendent Jovo Bikic | $171,143 | $178,765 | $196,669 | $210,443 | +23.0% |
| Assistant Superintendent Kenneth Cober | $165,873 | $171,290 | $189,829 | $205,731 | +24.0% |
| Assistant Superintendent David Vandergugten | $167,517 | $178,072 | $193,001 | $205,115 | +22.4% |
| Director, Human Resources Dana Sirsiris | $170,266 | $170,659 | $188,271 | $210,346 | +23.5% |
| Director, Learning Services Michael Scarcella | $154,217 | $161,168 | $178,730 | $185,573 | +20.3% |
| Senior Manager, Communications Irena Pochop | $104,865 | $116,755 | $125,850 | $140,896 | +34.4% |
| Assistant Secretary Treasurer Schulte → Rennie → Mo | $147,185 | $130,052 | $197,837 | $201,396 | +36.8%* |
Read the asterisks: these are position-to-position comparisons across incumbent changes, not individual raises. The superintendent changed during 2023–24, so that fiscal year contains remuneration for both Harry Dhillon and Teresa Downs and is not a normal annual comparison. Richard Rennie moved from Assistant Secretary Treasurer to Secretary Treasurer effective July 1, 2023.
Also important: SOFI reports remuneration paid, not contractual base salary. The figures are nominal and exclude expenses. Remuneration can be affected by start/end dates, retirement allowances, role changes and other paid amounts. The 2025 SOFI separately identifies a former-superintendent payment that includes a retirement allowance; it is not added to Teresa Downs’ 2025 remuneration above.
Facilities and IT: the titles and incumbents changed enough over the four-year window that I do not present a 2022→2025 “raise” percentage. Current 2025 remuneration was $197,567 for Director of Facilities Luigi Girotto and $185,814 for Director of Information Technology Kevin Abma. Their 2024 amounts were $174,134 and $172,996 respectively.
SCHOOL ACT
What is a trustee’s job?
“A board is responsible for the improvement of student achievement in the school district.”
In short: trustees act together as the Board of Education to set policy, approve budgets, oversee district management and property, monitor student results, and hold senior leadership accountable. Under section 65(3), an individual trustee cannot exercise the board’s powers alone; decisions belong to the board collectively.
School Act: ss. 65(1.1), 65(3), 74(1), 75(1) and 85(2)(a).
| District | Approx. students | Operating expense | Salaries + benefits | Labour share | Expense / student |
|---|---|---|---|---|---|
| SD42 Maple Ridge–Pitt Meadows | ≈ 17,000 | $211.2M | $193.7M | 91.7% | ≈ $12,424 |
| SD73 Kamloops–Thompson | ≈ 15,843 | $206.4M | $185.2M | 89.7% | ≈ $13,028 |
| SD61 Greater Victoria | ≈ 20,000 | $261.5M | $240.0M | 91.8% | ≈ $13,074 |
Near-average total cost
Using standardized funded FTE, SD42’s $12,591 operating cost is only 0.1% below the $12,604 B.C. average. This does not support calling the district broadly “overpriced.”
A labour-heavy budget
Salaries and benefits make up 91.7% of SD42 operating costs—2.0 percentage points above the provincial share. Only six other districts are higher.
Different staffing mix
Per funded FTE, SD42 is 1.9% above B.C. for teacher salaries, 39.6% above for educational assistants, and 14.7% below for principals and vice-principals.
MORE FUNDING—AND BETTER MANAGEMENT
The question is not only how much money we receive. It is how well we manage it.
B.C. must provide adequate, predictable funding for public education. But additional provincial funding alone does not answer whether current dollars are reaching classrooms and producing better conditions for students. In SD42, a total cost near the provincial average is only a starting point—not proof of value—especially when several spending categories and the labour share are above their provincial benchmarks.
Secure adequate funding
Advocate firmly for provincial funding that reflects enrolment, inclusion, complexity, inflation and local growth.
Explain the allocation
Reconcile every material variance in staffing, pay, classification and workload—particularly categories well above benchmark.
Measure the result
Connect budget choices to class conditions, safety, inclusion, attendance, literacy, numeracy and transparent public targets.
BEYOND THE PROVINCIAL AVERAGE
Average is not the finish line.
Nordic systems can offer valuable lessons in equity, trust and teacher professionalism. However, OECD PISA 2022 does not show Scandinavian countries generally outperforming Canada: Canada scored above Finland, Sweden and Norway in mathematics and reading, and above Sweden and Norway in science. For higher outcome benchmarks, Canada should also study systems such as Estonia, Japan, Korea and Singapore.
| System | Math | Reading | Science |
|---|---|---|---|
| Canada | 497 | 507 | 515 |
| Finland | 484 | 490 | 511 |
| Sweden | 482 | 487 | 494 |
| Norway | 468 | 477 | 478 |
| Singapore | 575 | 543 | 561 |
Responsible interpretation: PISA measures 15-year-old students’ performance, not financial efficiency. National scores cannot be used to judge SD42 directly. They show why benchmarking should combine spending, student outcomes and system design—and why “near average” should never end the inquiry. OECD flags sampling cautions for Canada’s 2022 results.
What the numbers do—and do not—say
Operating cost includes salaries and benefits plus services, supplies, utilities, transportation, professional development, insurance, and other operating items. A lower total operating cost can still have a high labour share. These comparisons do not show that individual employees are overpaid: category totals reflect staffing levels, job mix, collective agreements, vacancies, substitute use, and local program needs.
Method note
Province-wide figures combine Ministry Tables 1, 22 and 23: 2024–25 funded FTE enrolment and actual operating expenses by function and object. Provincial averages are enrolment- or expense-weighted, as appropriate. The three-district snapshot retains approximate reported headcounts and is directional only. Small and rural districts can have structurally higher per-student costs.
PRIMARY SOURCESB.C. province-wide tables SD42 2010–11 SOFI SD42 2017–18 SOFI Statistics Canada CPI 2018 inaugural board record 2011 inaugural board record Current SD42 trustees 2023 Secretary Treasurer record 2024 leadership record SD42 remuneration disclosure SD42 2021–22 SOFI SD42 2022–23 SOFI SD42 2023–24 SOFI SD42 2024–25 SOFI B.C. School Act SD42 financial statements SD73 financial statements SD61 financial statements OECD PISA 2022 — Canada OECD international results
MEET KOUROSH
A parent who will ask the questions that matter.
I’m a Maple Ridge parent, MBA graduate, finance and accounting professional, licensed residential builder, Realtor, and former commercial banker. Throughout my career, I have worked directly with financial information—from accounting and bookkeeping to reviewing financial statements, assessing business performance, and preparing detailed commercial lending and deal submissions.
That experience taught me to look beyond headline numbers, test assumptions, understand where money is going, and ask whether spending is delivering measurable value. I will bring that same financial discipline and independent judgment to the Board of Education.
MY FAMILY • MY COMMUNITY
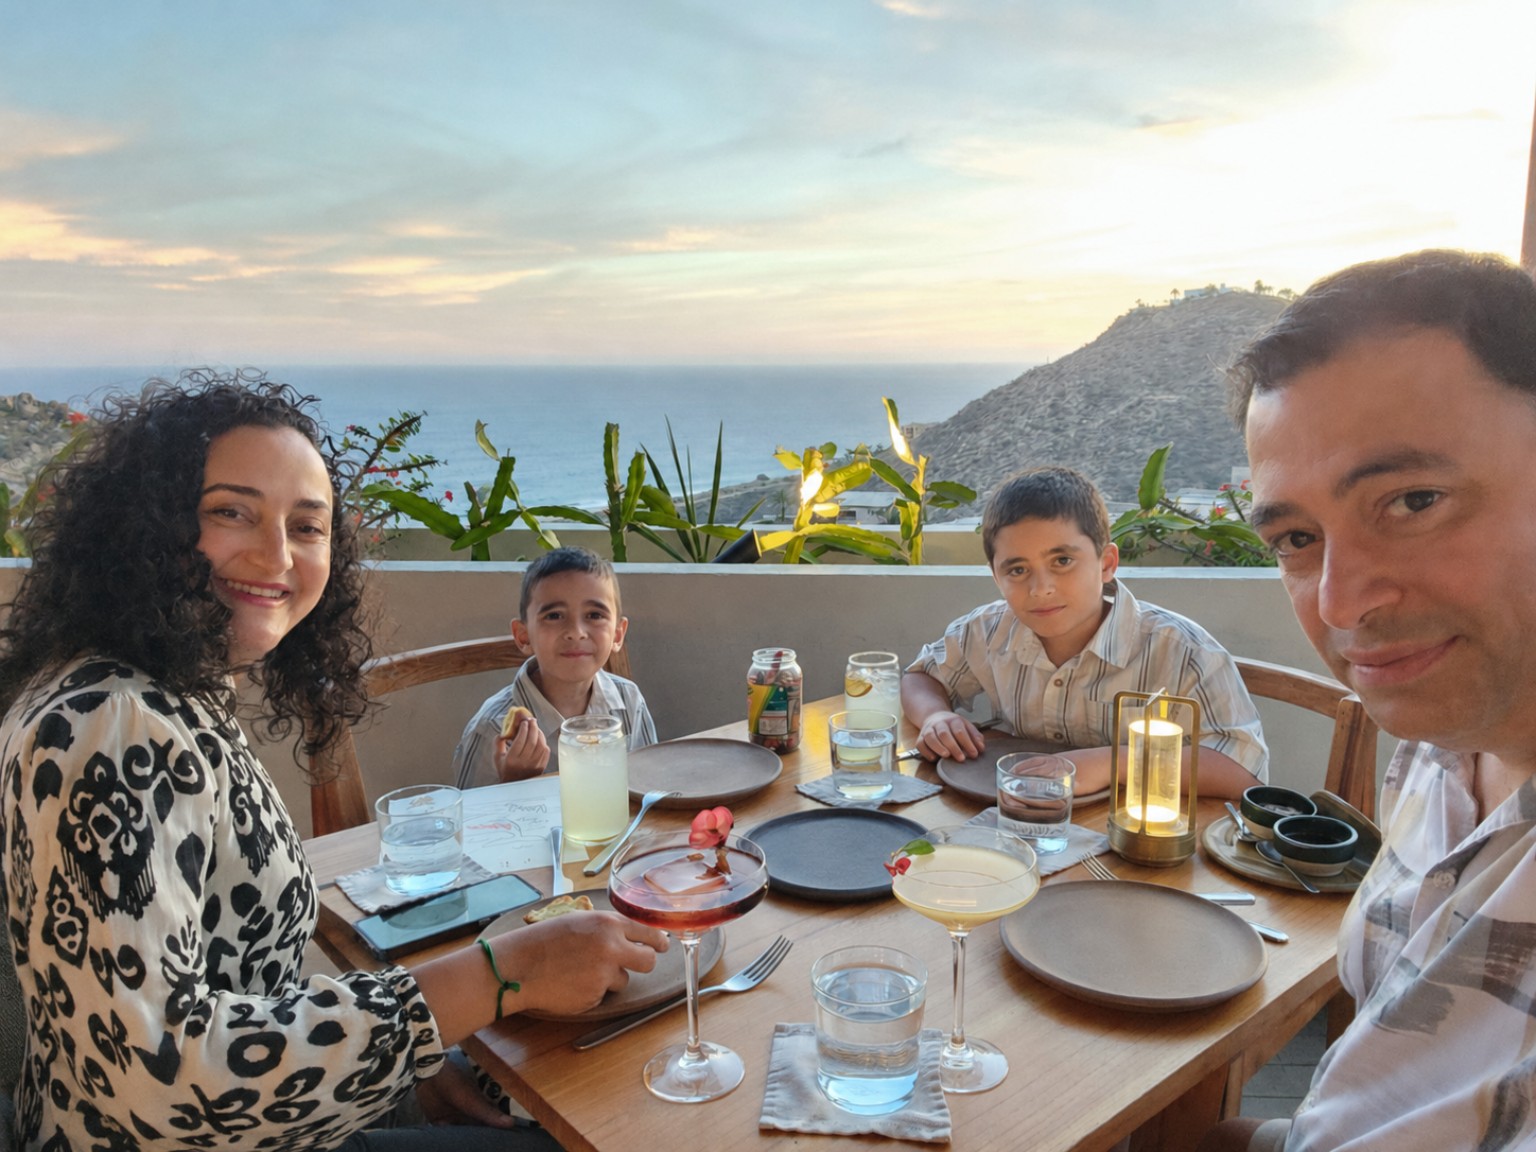
We are raising our children here.
My wife, Dr. Forouzandeh Alavi, is an optometrist serving families across our communities. Together, we are raising our two sons, Parsa, 8, and Pasha, 6, here in Maple Ridge. Like so many parents, our lives revolve around our children, their schools, their activities, their well-being, and giving them every opportunity to grow.
That is why public education is not an abstract issue for me—it is part of our family’s everyday life. I believe every family deserves to be heard and every child deserves a school system that responds with care, honesty, accountability, and urgency.
MBAStrategy & FinanceFinanceFinancial statements & deal analysisParentIn the SD42 community
EXPERIENCE & QUALIFICATIONS
Financial judgment.
Real-world leadership.
My career has crossed finance, accounting, commercial banking, real estate, construction, and business ownership. That range matters on a school board responsible for public funds, major facilities, staffing decisions, and long-term planning.
Professional experience
Commercial Realtor & Real Estate Advisor
Magsen Realty Inc. — investment sales, land assemblies, valuation, feasibility analysis, negotiations, and transaction strategy.
Licensed Residential Builder
Seysan Development & Builders Inc. — project budgeting, development finance, permitting, procurement, cost control, and contractor coordination.
Commercial Account Manager
BMO Bank of Montreal — managed and grew a commercial portfolio, reviewed financial statements, assessed credit risk, and prepared lending and deal submissions.
Finance, Accounting & Business Operations
Hands-on experience in accounting, bookkeeping, financial services, business management, consulting, budgeting, and performance analysis.
Education
MBAStrategy & Finance
University of Victoria, 2011
University of Victoria, 2011
International MBA StudyFinance & International Business
City University of Hong Kong · MBA Exchange, 2010
City University of Hong Kong · MBA Exchange, 2010
BSBMBusiness Management
University of Phoenix, 2008
University of Phoenix, 2008
AccountingCPA prerequisite education completed
Professional credentials
Board-ready skills
SHARE THE CAMPAIGN